
APCER and BPCER are acronyms for error rates used to quantify the performance of presentation attack detection (PAD) systems. This article provides some background on how they’re used and where they came from.
Presentation attack detection (PAD) protects a digital identity verification process from fraud. When a user presents biometrics or documents remotely as evidence of their identity, their biometric images must be demonstrated to be “live”, and their identity documents must be demonstrated to be in their physical possession. Otherwise, it is possible that a fraudster could present non-live “spoofs” to misrepresent their identity intentionally. Examples of spoofs are printed and copied facial photos, facial masks, and images of identity documents displayed on a digital screen.
Ideally, presentation attack detection should minimize friction for legitimate users and also avoid providing information to fraudsters on how to defeat the mechanism. More background about presentation attacks and liveness detection can be found here, as well as how a frictionless, single-frame approach to facial liveness works, plus an example of how it can dramatically reduce customer abandonment.
In the case of biometric matching algorithms such as those used for facial recognition, it helps to measure and report how they behave on a representative data sample in order to predict how the algorithm will perform in production. For an authentication use case, this might mean a prediction of the level of security provided and the impact on user experience. The same can be said for presentation attack detection algorithms. How frequent are errors when an assessment of a live image or a spoof is made?
APCER and BPCER are acronyms for error rates used to measure the performance of PAD subsystems. They stand for “attack presentation classification error rate” and “bona fide presentation classification error rate”, respectively. APCER and BPCER serve to quantify the accuracy of the classification of an image as either a live image or a spoof, and help to determine the tradeoff between security and convenience. They are analogous to error measurements for biometric matching algorithms used for identification and verification: false match rates (FMR), false non-match rates (FNMR), false accept rates (FAR), and false reject rates (FRR).They are similar, but there are reasons why we have three sets of error rates.
Statistical hypotheses testing
A bit of background on statistics and hypothesis testing helps clarify some of the confusion that is sometimes caused by the different metrics used to measure biometrics and PAD performance. The measurements are derived from statistical hypothesis testing, a foundational concept in scientific research where a hypothesis is defined and then tested to determine whether it is in fact true, with empirical data showing that the result is statistically significant; that is, the data provides evidence of a predictive relationship beyond that of probabilistic chance. The concept has been applied to biometric algorithm performance testing since its inception.
The figure below illustrates the collection and use of test data to demonstrate either that the “null hypothesis” is true and there is no statistically significant predictive relationship demonstrated, or rather that the “alternative hypothesis” is true, indicating that there is in fact a predictive relationship between variables that is beyond statistical chance. Data is collected, a threshold is set, and based on the results a conclusion can be drawn that is supported by statistical evidence. That is, do the results of the test demonstrate a causal relationship or are they a result of statistical chance? There will invariably be outliers in data collection and measurement, and these are quantified to assess the reliability of the results in terms of probability.
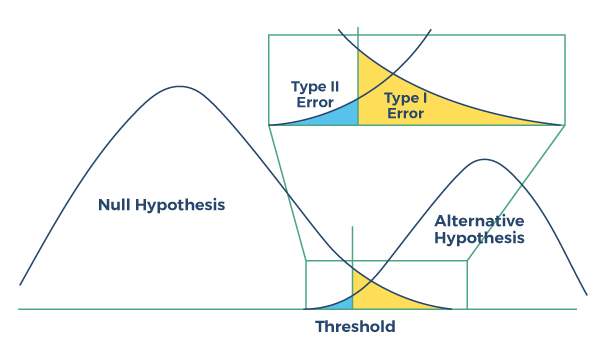 Figure: Hypothesis testing as a model for classifier performance
A Type I error rate measures the frequency of “errors of commission”; false positives, where a relationship or outcome is incorrectly determined and attributed, when in fact it is due only to statistical chance. A Type II error rate measures the frequency of “errors of omission”; false negatives, where a relationship or outcome is mistakenly concluded to be non-existent or due only to chance.
Error rates in biometrics
In biometrics, the performance of a comparison algorithm can be tested and understood with help from the hypothesis testing construct. If the alternative hypothesis can be demonstrated as true with statistical significance, then that serves as evidence that the results of the comparison are accurate and not random. But what is intuitive as the “null hypothesis” in this application can vary by the target use case, causing confusion in the terms of which error rate is which; that is, which outcome represents false positives and which represents false negatives?
In “one-to-many” biometric search applications as used by law enforcement for identifying an unknown person in a large database, the null hypothesis is fairly intuitive: the non-match. A biometric match is associated with the positive identification of a suspected bad actor among thousands or even millions of candidates.
In contrast to biometric identification applications, biometric verification and authentication compare the biometrics of a legitimate user to their own stored reference biometric; i.e. a match indicates not a bad actor but a bona fide user. In this case, which case is the null hypothesis and which is the alternative hypothesis becomes less intuitive, since a positive match is the most common and “correct” outcome. And yet, for this security use case, it is easy to see why a “positive” result could be considered the alternative hypothesis.
To summarize, in both use cases of biometrics, the alternative hypothesis is the positive biometric match. The confusion comes from the fact that in identification use cases, the positive match indicates a threat (e.g. a person in a database of convicted criminals), whereas in authentication, the negative match indicates a potential threat (someone attempting to impersonate a bona fide user).
Error rates in presentation attacks: APCER and BPCER
In detecting presentation attacks, classifier software may use techniques to either detect liveness, non-liveness, or both, and so knowing which are the null and alternative hypotheses becomes even less clear; is the null hypothesis representing detection of a bona fide sample, or of a spoof? The terms “APCER” and “BPCER” were devised to add clarity by including in their names specifically whether the error rate is measuring errors in attack classification or bona fide classification. 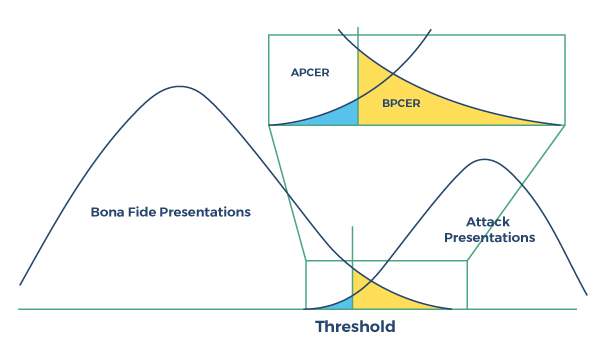 Figure: Presentation attack detection performance
So in the case of presentation attacks, thanks to the APCER and BPCER definitions, we always know what type of error rate we are talking about, with APCER representing attack classification errors and BPCER representing bona fide classification errors.
Performance visualization: DET curves and ROC curves
The performance of classification algorithms can be tuned to favor a particular outcome by adjusting a threshold, with the result being a tradeoff between Type I and Type II errors; false positives and false negatives. In the case of presentation attacks, this means a tradeoff between APCER and BPCER; security and user convenience.
DET curves are drawn to graphically represent the performance of one or more algorithms across a range of thresholds, and can be used to quickly compare algorithm performance. DET stands for “detection error tradeoff” and the curves plot false positives against false negatives on their axes. They graphically illustrate the performance of a classifier in terms of this tradeoff; what is the BPCER for a given APCER? The closer the line is to the origin, the better the overall performance.
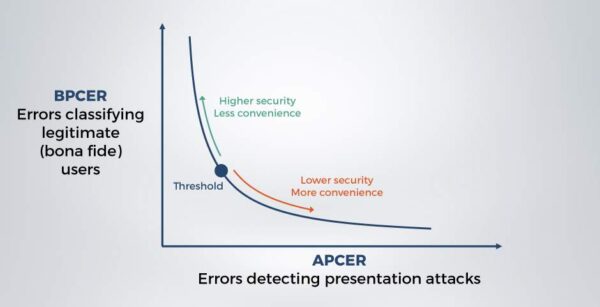
Figure: DET curve illustrating presentation attack detection classifier performance
Presentation attack detection algorithms are analogous to biometric matching algorithms in many ways. They are both used as classifiers, and their performance can be measured in terms of false positives and false negatives. In the case of presentation attack detection performance measurement, the acronyms APCER and BPCER favored by researchers and adopted by the market are fortunately more clear about what they mean. It helps to remember “A” stands for “Attack” and “B” stands for “Bona fide”.
Terms
| Null hypothesis | In statistical hypothesis testing, the observed result is an outcome due only to chance. |
|
Type I error False positive |
An error of commission. A mistaken rejection of the null hypothesis; i.e. a conclusion that an outcome or relationship is due to more than only chance when it is not. |
|
Type II error False negative |
An error of omission. The failure to reject the null hypothesis; i.e. a conclusion that an outcome or relationship is due only to chance when it is not. |
| APCER Attack presentation classification error rate |
The percentage ratio at which presentation attack examples are misidentified as a bona fide example. A higher value indicates higher security vulnerability. |
| BPCER Bona fide presentation classification error rate |
The percentage ratio at which bona fide examples are misidentified as a presentation attack example. A higher value indicates higher user friction. |
| FMR False match rate |
The percentage ratio at which a biometric system incorrectly identifies biometric samples from different individuals as being sourced from the same person. |
| FNMR False non-match rate |
The percentage ratio at which a biometric system incorrectly identifies biometric samples from the same individual as being sourced from different people. |
| FAR False accept rate |
In biometric systems, a false match rate in verification systems that factors the occurrence of multiple attempts and of failures to acquire. A higher value indicates higher vulnerability |
|
FRR False reject rate |
In biometric systems, a false non-match rate in verification systems that factors the occurrence of multiple attempts and of failures to acquire. A higher value indicates higher user friction. |
| FTA Failure to acquire |
A failure to collect a data sample, such as a biometric |
| DET curve | Detection error tradeoff; a plot of classifier performance across a range of thresholds illustrating false negative rates as a function of false positive rates |