
Methodologies for Algorithm Development in Support of Responsible AI Principles
Growing use of biometrics has prompted the need for consistent accuracy across races, ages, and genders. Where there is bias, there is the potential for individuals to have different experiences based on their appearance and demographics. For example, an individual might experience more difficulty in using their biometrics to authenticate, or be subject to a higher suspicion of fraud.
Bias is not limited to biometric matching algorithms. It also applies to presentation attack detection (“PAD”)[1], which is essential where facial recognition is used for unsupervised security processes such as digital onboarding, mobile login, and physical access control.
This article introduces a white paper that explores methodologies that ID R&D has employed mitigate bias in facial PAD algorithms in support of Responsible AI principles.
[1] https://www.iso.org/standard/53227.html
Defining Bias For Presentation Attack Detection
AI biases can be caused by imbalances in the underlying training data, or by the errors that creep into algorithm development as a result of human prejudices and false assumptions. In training, biases can result from the underrepresentation of certain demographics as well as the use of biased classification decisioning data.
The first question to answer related to a liveness system is “what is the nature of bias in a presentation attack detection system?” False-positive errors create inconvenience for customers, and this is where bias can occur in PAD systems. For example, if the system causes false positives for Black people at a higher rate than for White people, or males at a higher rate than females, then this is evidence of demographic bias in PAD systems. These false-positive errors contribute to the Bona Fide Presentation Classification Error Rate (“BPCER”). For a system to be considered unbiased, the PAD system must 1) be statistically equal across demographics and 2) must have a low BPCER.
Methodologies for Mitigating Bias
In order to mitigate AI bias in facial liveness algorithms, ID R&D analyzes demographic data to identify potential gaps in performance and drive ongoing algorithm improvements. The demographic variables are optimized for gender, age, and race. Additional subfactors that impact these groups are also tracked. One example is persons wearing hijabs, which is highly correlated with gender and ethnicity and also directly affects the performance of the facial liveness system.
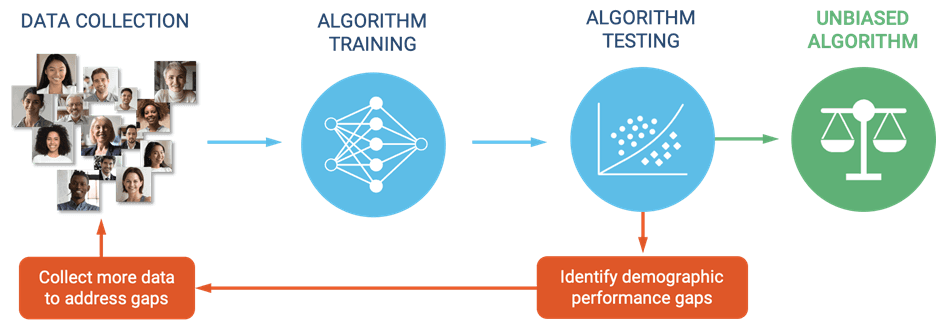
Figure 1. Algorithm development with focus on bias mitigation
Examples of Bias Reduction
The team took a number of actions to address bias and continues to apply methods to achieve fairness across demographics. The following are two examples:
Example 1 – Lower BPCER in Underrepresented Categories
ID R&D conducted a detailed analysis of the categories with lower performance. For the category of race, data scientists looked at the groups Black, Asian, Caucasian, and Indian.
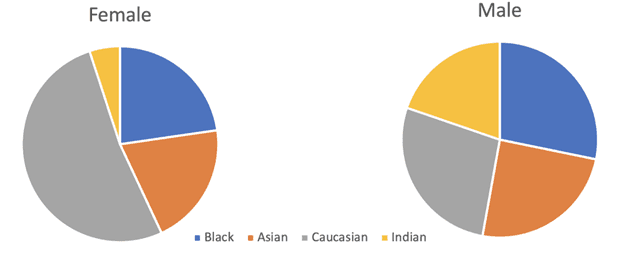
Figure 2. Distribution by race and gender.
Knowing the distribution, the following conclusions can be drawn:
- More data needs to be collected for under-represented categories
- During training, the focus should be put on the less represented categories
- When evaluating the quality of the algorithm, it is worth choosing a model that works equally well in all categories
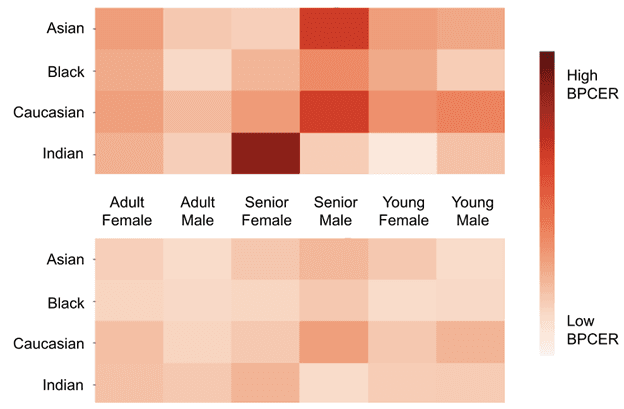
Figure 3. BPCER heatmap before and after applying more data for poor data categories and weighted sampling while training.
Example 2 – Lower BPCER for Sub-Category Features
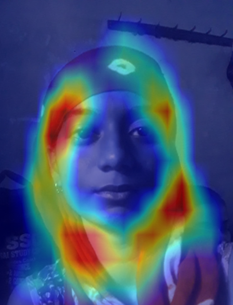
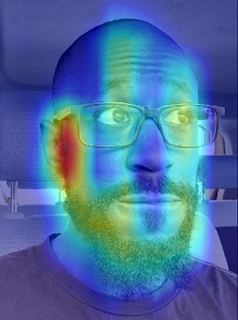
ID R&D conducted a detailed analysis of the conditions in which performance was poor. For categories where algorithms underperformed, teams analyzed images in the dataset to determine the areas of the image deemed “important” when making its prediction. This method helps determine discriminating areas in the image.

(a)
(b)

(c)
(d)
Figure 4. Heat maps of neural network demonstrate the area of interest of the facial anti-spoofing algorithm: a) original image of a woman in the national headdress, b) heat map of neural network has higher attention on the medium and bottom parts of the headdress, c) original image of a man with mustache and beard, d) heat map of neural network has attention on the bottom part of the face as well as on the part of beard close to the ear.
Bias Performance – Test Report
According to ID R&D’s definition of bias, the ultimate goal is to operationalize software development methodologies in support of Responsible AI principles to achieve as close as possible to 0% BPCER across age, race, and gender.
In support of this goal, ID R&D commissioned the first independent evaluation of bias in facial liveness detection. Bixelab, an independent, accredited biometrics laboratory performed a comprehensive assessment of ID R&D facial liveness detection technology for bias in target demographics, including age, gender, and race/ethnicity.
The following error metric calculation methodology was used:
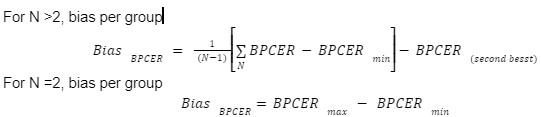
Where N is the total number of attributes in a demographic group. For example, the attributes in Race group are Caucasian, African, East Asian, and South Asian.
The results of the evaluation demonstrate that the software performs with levels of bias below critical target values. These are illustrated in the following table. The full report with complete details of the test is available from ID R&D.
Table: Summary of performance variation measured for each demographic group and corresponding bias decisions
| Group | Bias metric | Critical Value (95% confidence
level) |
Null Hypothesis
Accept: Bias Metric < Critical Value Reject: Bias Metric > Critical Value |
Bias:
Unbiased if Null Hypothesis is accepted Biased if Null Hypothesis is rejected |
| Age | 0.0008 | 0.002 | Accept | Unbiased |
| Gender | 0.002 | 0.004 | Accept | Unbiased |
| Race/ethnicity | 0.0025 | 0.0031 | Accept | Unbiased |
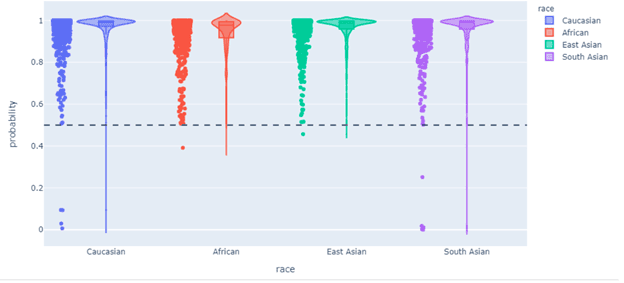
Chart: Violin plots illustrate the probability of false rejection for different races
Conclusion
Bias must be actively addressed for both biometric comparators and for presentation attack detection. Bias is particularly pronounced for face biometrics. Responsible AI principles guide the use of methodologies to remove bias. Independent third-party validation proves that applying these principles results in a Presentation Attack Detection system that is fair and generally free of bias.
ID R&D’s neural networks were trained on extremely large amounts of image data. By ensuring adequate representation from all demographics, ID R&D PAD algorithms can perform nearly equally across all races and genders. Future work will continue to apply these techniques toward lowering bias and driving down BPCER across all demographics. The work will continue to adhere to methodologies that support Responsible AI principles.
The full white paper can be found here. Learn more about ID R&D’s passive facial liveness technology and products.